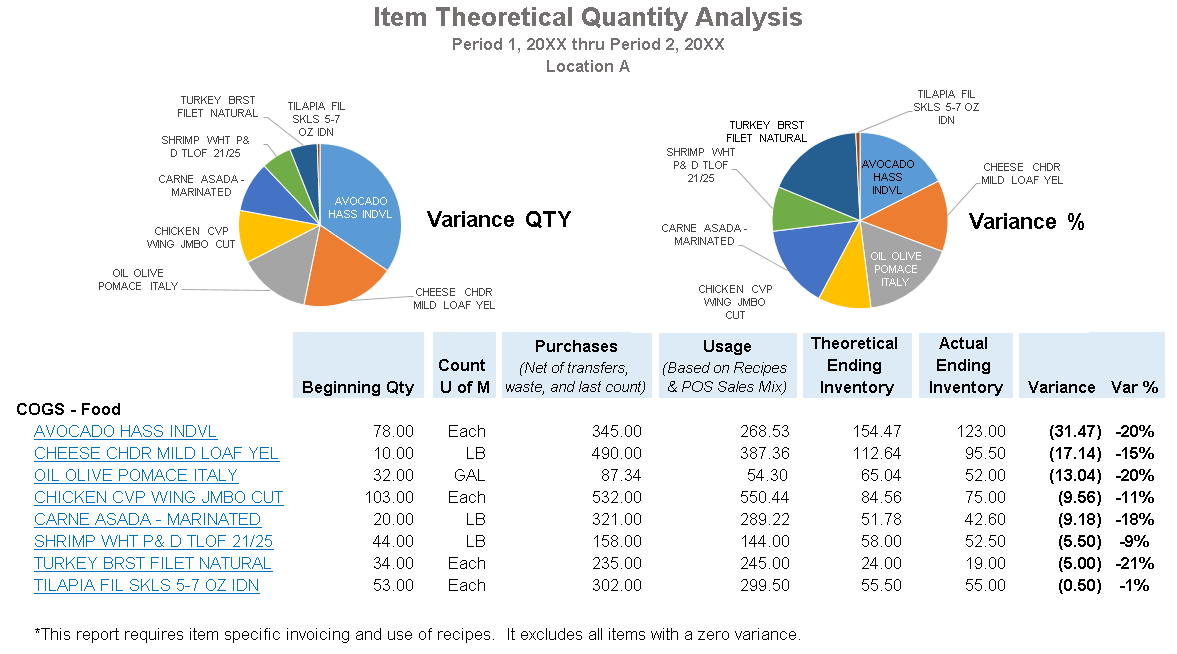
Items used totals for any span of periods, then broken down by locations. The report utilizes purchases, stock counts, and budgets based on the quantity of menu items sold (Pmix) to come up with a difference between actual and expected. It then breaks down how much of the difference is attributable to item quantity increases/decreases, waste & spoilage, and all other reasons. From this report the user can easily see where to focus time and energy tightening the control of food costs.